Nifty Option Chain Analysis: Complete Beginner’s Guide
The Nifty Option Chain is one of the most valuable tools available to traders in the Indian stock market. Whether you are trading options, futures, or simply trying to understand market sentiment, option chain analysis can provide insights that are difficult to obtain from price charts alone.
Many professional traders use option chain data to identify support and resistance levels, track institutional activity, measure market sentiment, and improve trade timing. However, beginners often find the option chain intimidating because of the large amount of data displayed.
This guide explains the Nifty Option Chain in simple terms and shows how traders use it to make informed trading decisions.
What Is the Nifty Option Chain?
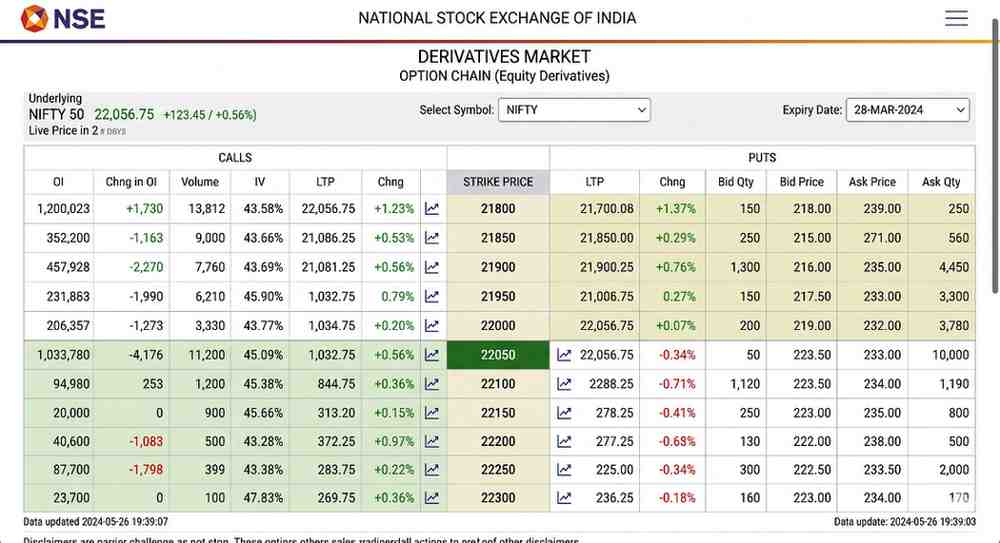
The Nifty Option Chain is a table that displays all available call and put options for the Nifty 50 index across different strike prices and expiry dates.
For each strike price, the option chain provides information such as:
- Open Interest (OI)
- Change in Open Interest
- Trading Volume
- Last Traded Price (LTP)
- Implied Volatility (IV)
- Bid and Ask Prices
By analyzing this data, traders can understand where market participants are placing their bets and identify key support and resistance levels.
Understanding Calls and Puts
Before reading an option chain, it’s important to understand the two types of options:
Call Option
A call option gives the buyer the right to buy the underlying asset at a specified strike price before expiry.
Traders generally buy calls when they expect the market to rise.
Put Option
A put option gives the buyer the right to sell the underlying asset at a specified strike price before expiry.
Traders generally buy puts when they expect the market to fall.
Key Components of the Nifty Option Chain
Open Interest (OI)
Open Interest represents the total number of outstanding option contracts that have not yet been closed or settled.
High OI often indicates strong participation at a particular strike price.
Traders use OI to identify potential support and resistance levels.
Change in Open Interest
Change in OI shows how many contracts have been added or removed during the trading session.
A significant increase in OI often indicates fresh positions being created.
A decline in OI may indicate traders are closing positions.
Volume
Volume represents the number of contracts traded during the day.
High volume usually indicates increased market interest in a particular strike price.
Last Traded Price (LTP)
LTP is the most recent price at which an option contract was traded.
It helps traders assess the premium value of an option.
Implied Volatility (IV)
Implied Volatility measures expected future volatility.
Higher IV generally leads to higher option premiums.
Lower IV usually results in cheaper option prices.
How to Read the Nifty Option Chain
Step 1: Identify the Current Nifty Price
Locate the strike prices nearest to the current Nifty index value.
These are known as:
- At-The-Money (ATM)
- Near-The-Money strikes
These strikes typically have the highest trading activity.
Step 2: Check Highest Put OI
The strike price with the highest Put Open Interest is often considered a support level.
A large number of traders believe the market is likely to remain above this level.
Step 3: Check Highest Call OI
The strike price with the highest Call Open Interest is often considered a resistance level.
Many traders expect the market to stay below this level.
Step 4: Analyze Change in OI
Fresh additions in OI can indicate new bullish or bearish positions.
Monitoring these changes throughout the day can reveal evolving market sentiment.
Using Option Chain to Find Support and Resistance
One of the most popular uses of option chain analysis is identifying support and resistance.
Support
High Put OI often acts as support because traders are willing to sell puts at that strike price.
Resistance
High Call OI often acts as resistance because traders are willing to sell calls at that strike price.
Keep in mind that these levels can change as market participants adjust their positions.
What Is Put Call Ratio (PCR)?
The Put Call Ratio is a popular sentiment indicator.
PCR is calculated by dividing total Put Open Interest by total Call Open Interest.
A higher PCR generally indicates bullish sentiment, while a lower PCR may indicate bearish sentiment.
However, PCR should not be used as a standalone trading signal.
It works best when combined with OI analysis and price action.
Understanding Market Positioning Through OI
Long Build-Up
Price Up + OI Up
This indicates fresh bullish positions are being created.
Short Build-Up
Price Down + OI Up
This indicates fresh bearish positions are being created.
Short Covering
Price Up + OI Down
This suggests traders are closing bearish positions.
Long Unwinding
Price Down + OI Down
This suggests traders are exiting bullish positions.
Understanding these four conditions can help traders interpret market sentiment more effectively.
How Intraday Traders Use the Option Chain
Intraday traders often monitor:
- OI changes
- Volume spikes
- PCR trends
- Support and resistance levels
- Implied Volatility
By combining option chain analysis with price action, traders can identify potential breakout and reversal opportunities.
Common Mistakes Beginners Make
Looking Only at OI
OI should always be analyzed along with price action and volume.
Ignoring Change in OI
Change in OI often provides more useful information than total OI alone.
Treating Support and Resistance as Fixed Levels
These levels can shift during the trading session.
Ignoring Implied Volatility
IV can significantly impact option premiums.
Trading Without Risk Management
No indicator guarantees success.
Always use stop losses and proper position sizing.
Best Practices for Option Chain Analysis
- Monitor OI and Change in OI together.
- Track major support and resistance levels.
- Observe PCR trends.
- Watch Implied Volatility.
- Confirm signals using price action.
- Follow the broader market trend.
- Maintain disciplined risk management.
Conclusion
The Nifty Option Chain is a powerful tool that helps traders understand market sentiment, identify support and resistance levels, and track institutional positioning. While it cannot predict the market with certainty, it can provide valuable insights when used correctly.
Successful traders use option chain analysis as part of a broader trading strategy that includes technical analysis, price action, and risk management. By learning how to interpret OI, PCR, IV, and market positioning, beginners can improve their understanding of market behavior and make more informed trading decisions.
FAQs
What is the Nifty Option Chain?
The Nifty Option Chain is a table showing all available call and put options for the Nifty 50 index across various strike prices and expiry dates.
What is Open Interest in the Option Chain?
Open Interest represents the total number of active option contracts that have not been closed or settled.
How do I find support and resistance using the Option Chain?
High Put OI often indicates support, while high Call OI often indicates resistance.
What is PCR in Option Chain Analysis?
PCR stands for Put Call Ratio and is used to gauge overall market sentiment.
Is Option Chain Analysis useful for intraday trading?
Yes. Many traders use OI, PCR, and support-resistance levels from the option chain for intraday trading decisions.
Can Option Chain Analysis predict market direction?
No. It provides probabilities and market sentiment, not guaranteed predictions.
How to Read the Nifty Option Chain for Beginners: Step-by-Step Guide