What Is Open Interest (OI) in the Nifty Option Chain?
Open Interest (OI) is one of the most important concepts in option chain analysis. Whether you are an intraday trader, swing trader, or options seller, understanding Open Interest can help you identify market sentiment, support and resistance levels, and potential trading opportunities.
Many beginners focus only on price movement, but experienced traders often pay close attention to Open Interest because it provides insight into where traders are actively creating positions.
In this guide, you’ll learn what Open Interest is, how it works, how to interpret it in the Nifty Option Chain, and how traders use it in real-world trading.
What Is Open Interest?
Open Interest represents the total number of outstanding option contracts that are currently active and have not been closed, exercised, or expired.
In simple terms, Open Interest tells you how many positions are still open in a particular option contract.
For example:
If 10,000 Nifty Call Option contracts are currently active and remain open, the Open Interest for that strike price will be 10,000.
The higher the Open Interest, the greater the trader participation at that strike.
How Is Open Interest Created?
Open Interest increases when a new buyer and a new seller create a fresh option contract.
Example:
- Trader A buys one Call Option.
- Trader B sells one Call Option.
A new contract is created.
Result:
Open Interest increases by one.
How Does Open Interest Decrease?
Open Interest decreases when existing positions are closed.
Example:
- Trader A closes a previously purchased option.
- Trader B closes the corresponding sold option.
Result:
Open Interest decreases.
This indicates traders are exiting positions rather than creating new ones.
Why Is Open Interest Important?
Open Interest helps traders understand:
- Market participation
- Trader positioning
- Potential support levels
- Potential resistance levels
- Strength of trends
- Institutional activity
Unlike price alone, Open Interest provides insight into what traders are doing behind the scenes.
Open Interest vs Volume
Many beginners confuse Open Interest with Volume.
Open Interest
Open Interest shows the total number of active contracts currently open.
Volume
Volume shows the number of contracts traded during the day.
Example
Suppose:
- Open Interest = 100,000 contracts
- Today’s Volume = 25,000 contracts
This means 100,000 contracts remain open, while 25,000 contracts changed hands during the trading session.
Volume measures activity.
Open Interest measures outstanding positions.
How Traders Use Open Interest in the Nifty Option Chain
Identifying Support Levels
High Put Open Interest often indicates support.
Why?
Because traders selling puts generally expect the market to stay above that strike price.
For example:
If the highest Put OI is at 24,800, traders may view 24,800 as an important support level.
Identifying Resistance Levels
High Call Open Interest often indicates resistance.
Why?
Because traders selling calls generally expect the market to remain below that strike.
For example:
If the highest Call OI is at 25,200, traders may view 25,200 as a major resistance level.
What Is Change in Open Interest?
Change in Open Interest measures how many contracts have been added or removed during the current trading session.
This metric often provides more actionable information than total Open Interest.
Positive Change in OI
Indicates fresh positions are being added.
Negative Change in OI
Indicates positions are being closed.
Monitoring changes throughout the day helps traders understand evolving market sentiment.
Understanding Market Sentiment Through OI
Traders often combine price movement with Open Interest to understand market behavior.
Long Build-Up
Price Rising + OI Rising
Indicates fresh bullish positions.
This suggests traders expect further upside.
Short Build-Up
Price Falling + OI Rising
Indicates fresh bearish positions.
This suggests traders expect further downside.
Short Covering
Price Rising + OI Falling
Indicates bearish traders are closing positions.
This often leads to sharp upward moves.
Long Unwinding
Price Falling + OI Falling
Indicates bullish traders are exiting positions.
This suggests weakening bullish sentiment.
How to Find Strong Support and Resistance Using OI
Many traders use a simple process:
Step 1
Locate the strike with the highest Put OI.
This often represents support.
Step 2
Locate the strike with the highest Call OI.
This often represents resistance.
Step 3
Monitor Change in OI.
Shifting OI levels may indicate support and resistance levels are moving.
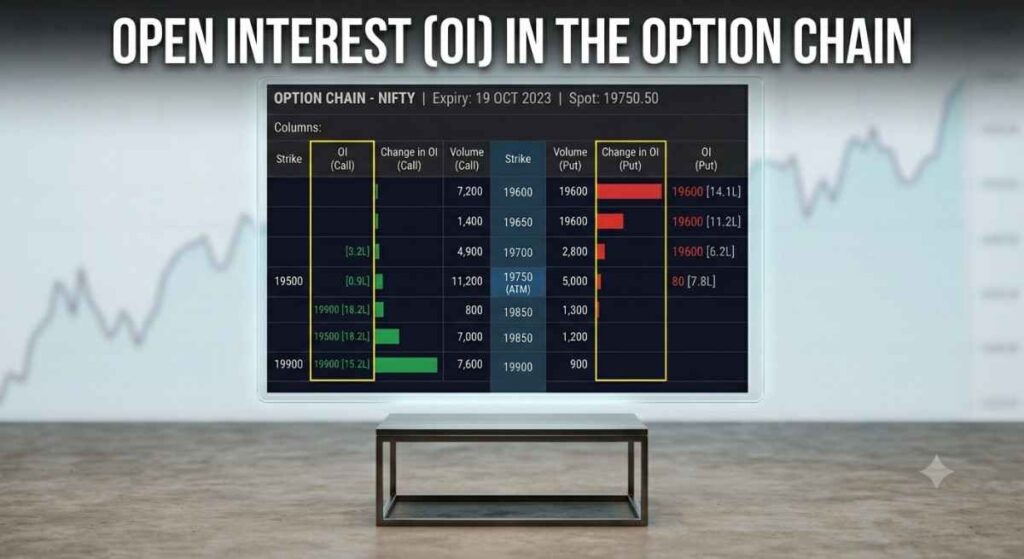
Example of OI Analysis
Assume Nifty is trading at 25,000.
Option Chain Data:
- Highest Put OI = 24,800
- Highest Call OI = 25,200
Possible interpretation:
- Support = 24,800
- Resistance = 25,200
- Expected range = 24,800 to 25,200
If Put OI increases significantly at 24,900, support may strengthen.
If Call OI starts moving from 25,200 to 25,300, resistance may shift higher.
Advantages of Using Open Interest
Helps Identify Key Market Levels
OI often highlights important support and resistance zones.
Shows Trader Participation
Higher OI generally indicates greater market interest.
Improves Trend Analysis
Combining price and OI helps traders understand whether trends are strengthening or weakening.
Useful for Intraday and Positional Trading
Both short-term and long-term traders use OI data to improve decision-making.
Limitations of Open Interest
While OI is useful, it should not be used alone.
OI Does Not Predict Direction
High OI only indicates participation.
It does not guarantee price movement.
Support and Resistance Can Break
Markets can move beyond high OI levels during strong trends or major news events.
OI Works Best with Other Tools
Combine OI analysis with:
- Price action
- Volume
- Technical indicators
- Market trend analysis
Common Mistakes Traders Make with OI
Looking Only at Total OI
Always analyze Change in OI as well.
Ignoring Price Action
OI should support price analysis, not replace it.
Assuming High OI Guarantees Reversal
Support and resistance are probability zones, not guaranteed turning points.
Ignoring Market Trend
Trading against strong trends solely based on OI can be risky.
Best Practices for OI Analysis
- Monitor both OI and Change in OI.
- Track the highest Put and Call OI levels.
- Watch for sudden OI shifts.
- Combine OI with price action.
- Confirm signals using market trend.
- Use proper risk management.
Conclusion
Open Interest is one of the most powerful tools available in the Nifty Option Chain. It helps traders identify support and resistance levels, understand market sentiment, and track trader positioning.
However, OI should not be used in isolation. The most successful traders combine Open Interest analysis with price action, volume, trend analysis, and disciplined risk management.
By understanding how Open Interest works and how it interacts with market movement, beginners can significantly improve their option chain analysis skills.
FAQs
What is Open Interest in the Nifty Option Chain?
Open Interest is the total number of active option contracts that remain open and have not yet been closed or settled.
What does high Open Interest mean?
High Open Interest indicates strong trader participation at a particular strike price.
What is the difference between OI and Volume?
OI shows active outstanding contracts, while Volume shows how many contracts were traded during the day.
How does OI help identify support and resistance?
High Put OI often indicates support, while high Call OI often indicates resistance.
Can Open Interest predict market direction?
No. Open Interest helps analyze trader positioning and market sentiment but should be combined with other forms of analysis.
See also – How to Read the Nifty Option Chain for Beginners: Step-by-Step Guide