How to Trade with Support and Resistance
Introduction
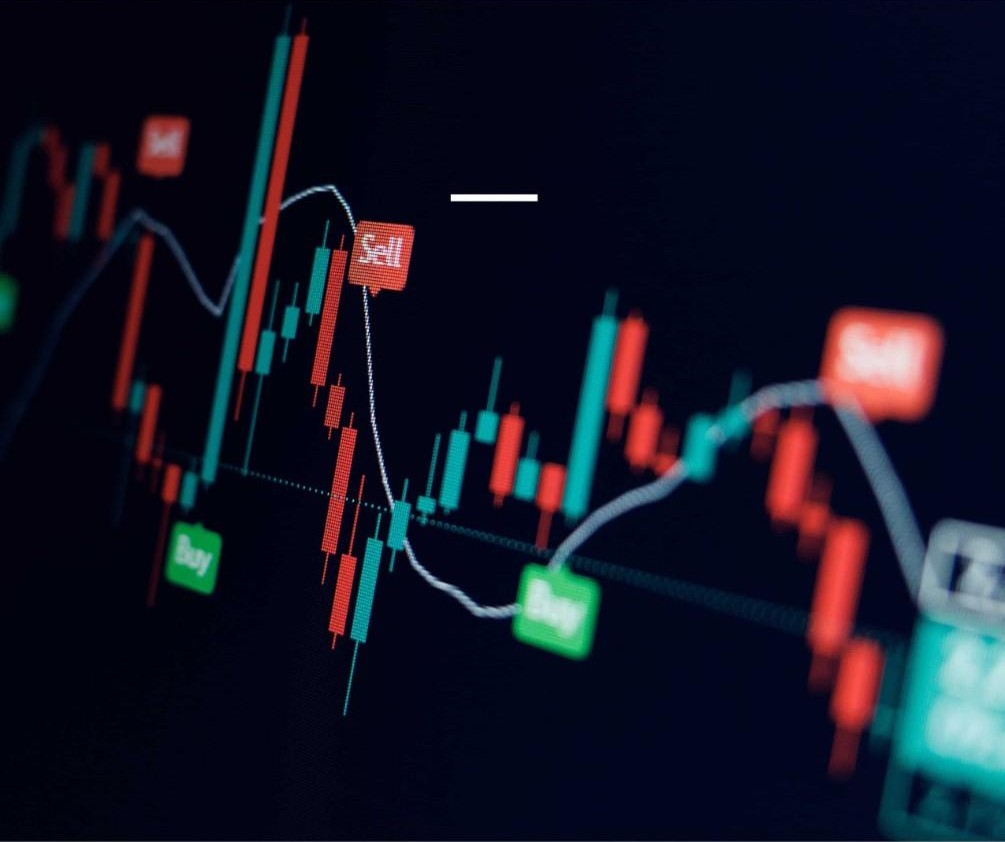
Support and resistance are the backbone of technical analysis. These levels act as psychological barriers where price tends to pause, reverse, or break through. Traders who master support and resistance can anticipate market moves, plan precise entries, and manage risk effectively.
🔍 What Are Support and Resistance?
- Support: A price level where demand is strong enough to prevent further decline. Traders often buy at support.
- Resistance: A price level where selling pressure halts upward movement. Traders often sell or short at resistance.
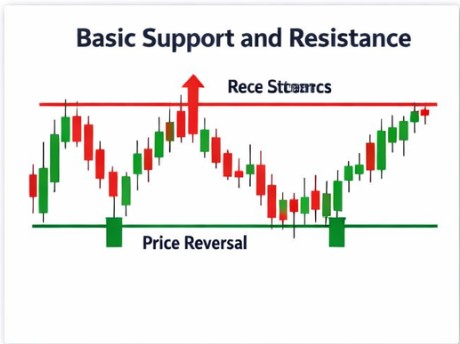
Think of support as the “floor” and resistance as the “ceiling” of price action.
📊 How to Identify Support and Resistance Levels
- Historical Price Action – Look for areas where price repeatedly reversed.
- Round Numbers – Levels like 100, 1000, or 10,000 often act as psychological barriers.
- Moving Averages – Dynamic support/resistance that shifts with price.
- Trendlines & Channels – Diagonal levels that guide price movement.
- Volume Profile – High trading activity zones often mark strong support/resistance.
🎯 Trading Strategies Using Support and Resistance
1. Bounce Strategy
- Buy near support when price shows bullish reversal signals.
- Sell near resistance when price shows bearish rejection.
- Confirm with candlestick patterns (hammer, shooting star).
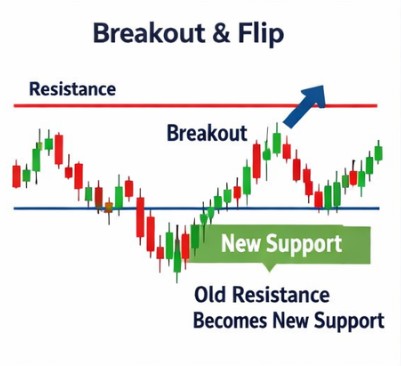
2. Breakout Strategy
- Enter trades when price breaks above resistance or below support.
- Use volume confirmation to avoid false breakouts.
- Place stop‑loss just beyond the broken level.
3. Range Trading
- Identify sideways markets where price oscillates between support and resistance.
- Buy at support, sell at resistance, repeat until breakout occurs.
📐 Support & Resistance: Level vs Zone
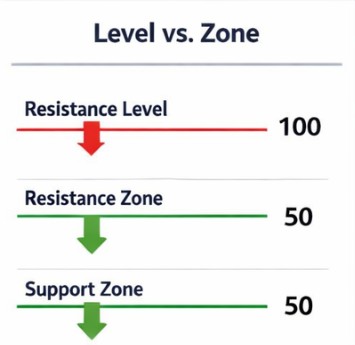
- Level: A precise price point (e.g., $100).
- Zone: A range around a price (e.g., $98–$102).
- Zones are more reliable because markets rarely respect exact numbers.
🗂️ Types of Support and Resistance
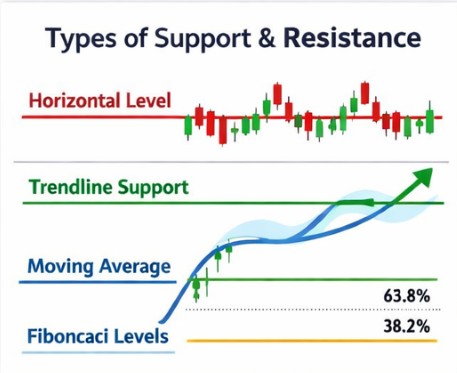
- Horizontal Levels – Based on past highs and lows.
- Trendline Support/Resistance – Diagonal levels along a trend.
- Moving Averages – Dynamic levels that shift with price.
- Psychological Levels – Round numbers like 100, 1000, etc.
- Fibonacci Levels – Derived from retracement ratios.
⏳ Multiple Time Frame Support and Resistance
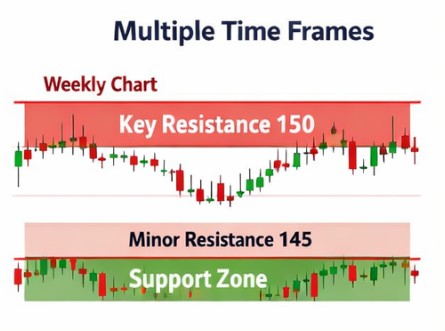
- Strong levels on higher time frames (weekly/monthly) carry more weight.
- Short‑term traders use intraday levels for precise entries.
- Combining both gives a balanced view.
📍 Where Are Support and Resistance Formed?
- At previous swing highs/lows.
- Around consolidation zones.
- Near volume clusters where heavy trading occurred.
💪 Strength of Support and Resistance
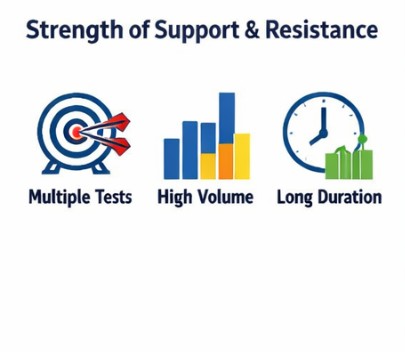
- Number of touches: More tests = stronger level.
- Volume traded: High activity strengthens the zone.
- Time spent: Longer consolidation = stronger support/resistance.
⚡ When Do Support and Resistance Break?
- When volume spikes during a breakout.
- When fundamental news shifts market sentiment.
- When trend momentum overwhelms existing levels.
⚖️ Risk Management Tips
- Always use stop‑loss orders below support or above resistance.
- Avoid trading weak levels with little historical significance.
- Combine support/resistance with indicators like RSI or MACD for confirmation.
- Risk only 1–2% of your capital per trade.
🧠 Trading Psychology
Support and resistance are not just technical—they reflect trader psychology.
- Support: Buyers step in, believing the asset is undervalued.
At support, buyers feel confident.
- Resistance: Sellers dominate, thinking the asset is overpriced.
At resistance, sellers dominate. Understanding this sentiment helps anticipate market behavior.
- These levels reflect collective trader sentiment, not just chart patterns.
✅ Conclusion
Trading with support and resistance is a timeless strategy used across forex, stocks, and crypto. By identifying key levels, applying bounce or breakout strategies, and managing risk, traders can build consistent profitability.
Supply and Demand Zone Trading – Complete guide
FAQ
Support is a price level where demand prevents further decline, often acting as a floor in technical analysis.
Resistance is a price level where selling pressure halts upward movement, often acting as a ceiling in technical analysis.
Traders use support and resistance to plan entries, exits, and stop-loss placements through bounce, breakout, or range strategies.
“How to Read Candlestick Patterns”