
How to Read the Nifty Option Chain for Beginners
If you are new to options trading, the Nifty Option Chain may look confusing at first. With dozens of strike prices and multiple columns showing Open Interest, Volume, Implied Volatility, and premiums, many beginners don’t know where to start.
The good news is that you don’t need to understand every column to begin using the option chain effectively. By focusing on a few key metrics, you can quickly identify market sentiment, support and resistance levels, and potential trading opportunities.
This guide explains how to read the Nifty Option Chain step by step in a simple and practical way.
What Is the Nifty Option Chain?
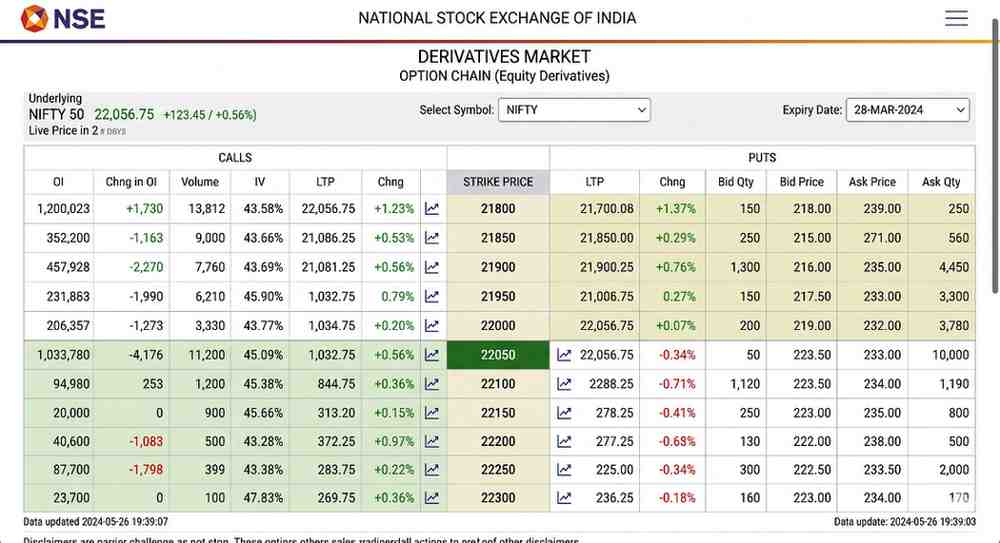
The Nifty Option Chain is a table that displays all available call and put options for the Nifty 50 index.
For each strike price, the option chain provides important information such as:
- Open Interest (OI)
- Change in Open Interest
- Trading Volume
- Implied Volatility (IV)
- Last Traded Price (LTP)
- Bid and Ask Prices
Traders use this information to understand how market participants are positioned.
Understanding the Basic Layout
The option chain is divided into three main sections:
Call Option Data (Left Side)
The left side typically contains information related to Call Options.
Call options are generally used when traders expect the market to move higher.
Strike Prices (Middle)
The center column contains strike prices.
These are the levels at which option contracts are available.
Put Option Data (Right Side)
The right side contains information related to Put Options.
Put options are generally used when traders expect the market to move lower.
Step 1: Find the Current Nifty Price
Before analyzing anything else, locate the current Nifty index value.
For example:
If Nifty is trading at 25,000, then:
- 25,000 is the At-The-Money (ATM) strike.
- Strike prices above 25,000 are Out-of-The-Money Calls.
- Strike prices below 25,000 are Out-of-The-Money Puts.
Most trading activity occurs near the ATM strikes.
Step 2: Analyze Open Interest (OI)
Open Interest represents the total number of active option contracts.
High OI generally indicates strong trader participation at a strike price.
Why OI Matters
Traders use OI to identify important market levels.
- High Put OI often indicates support.
- High Call OI often indicates resistance.
For example:
If the highest Put OI is at 24,800, traders may view 24,800 as a support level.
If the highest Call OI is at 25,200, traders may view 25,200 as a resistance level.
Step 3: Monitor Change in Open Interest
Change in OI shows how many contracts have been added or removed during the trading session.
This often provides more useful information than total OI.
Positive Change in OI
Indicates fresh positions are being added.
Negative Change in OI
Indicates positions are being closed.
Large changes in OI can reveal where traders are actively positioning themselves.
Step 4: Look at Trading Volume
Volume shows how many option contracts were traded during the day.
High volume generally indicates:
- Increased interest
- Better liquidity
- More reliable price discovery
Strike prices with both high volume and high OI often attract trader attention.
Step 5: Understand Implied Volatility (IV)
Implied Volatility reflects expected future price movement.
High IV
- Higher option premiums
- Greater expected volatility
Low IV
- Lower option premiums
- Lower expected volatility
IV becomes especially important before major events such as:
- RBI announcements
- Budget sessions
- Election results
- Major global events
Step 6: Use OI to Find Support and Resistance
One of the simplest ways to use the option chain is to identify support and resistance levels.
Support Level
The strike with the highest Put OI often acts as support.
Resistance Level
The strike with the highest Call OI often acts as resistance.
Many traders use these levels to plan entries and exits.
Step 7: Check the Put Call Ratio (PCR)
PCR is calculated by dividing total Put Open Interest by total Call Open Interest.
PCR Above 1
May indicate bullish sentiment.
PCR Below 1
May indicate bearish sentiment.
PCR should always be analyzed together with price action and OI trends.
Understanding Market Positioning
The option chain can help identify four important market conditions.
Long Build-Up
Price Up + OI Up
Indicates fresh bullish positions.
Short Build-Up
Price Down + OI Up
Indicates fresh bearish positions.
Short Covering
Price Up + OI Down
Indicates bearish traders closing positions.
Long Unwinding
Price Down + OI Down
Indicates bullish traders exiting positions.
These signals help traders understand the market’s underlying sentiment.
Example of Simple Option Chain Analysis
Assume:
- Nifty = 25,000
- Highest Put OI = 24,800
- Highest Call OI = 25,200
Possible interpretation:
- Support = 24,800
- Resistance = 25,200
- Trading range = 24,800 to 25,200
If Call OI starts shifting higher and resistance moves upward, it may indicate bullish sentiment.
If Put OI starts reducing significantly, support may weaken.
Common Beginner Mistakes
Looking Only at OI
Always combine OI with price action and volume.
Ignoring Change in OI
Fresh positioning often provides better clues than total OI.
Trading Against Strong Trends
Option chain signals work best when aligned with the broader market trend.
Ignoring Risk Management
No option chain signal is guaranteed.
Always use stop losses and proper position sizing.
Overtrading Every Signal
Not every OI change creates a valid trading opportunity.
Patience is often more profitable than frequent trading.
Best Practices for Beginners
- Focus on ATM and near-the-money strikes.
- Monitor OI and Change in OI together.
- Watch PCR trends.
- Use support and resistance levels.
- Confirm signals with price action.
- Follow market trends.
- Manage risk carefully.
Conclusion
Learning how to read the Nifty Option Chain can significantly improve your understanding of market sentiment and trader positioning. By focusing on Open Interest, Change in OI, PCR, Volume, and Implied Volatility, beginners can identify important support and resistance levels and make more informed trading decisions.
Remember that the option chain is a tool for analyzing probabilities, not predicting the future. Combining option chain analysis with technical analysis and risk management can help traders improve consistency over time.
FAQs
How do beginners read the Nifty Option Chain?
Beginners should focus on current Nifty price, Open Interest, Change in OI, PCR, and support-resistance levels.
Which is the most important column in the Option Chain?
Open Interest and Change in Open Interest are generally considered the most important metrics.
What is the easiest way to find support and resistance?
Look for the strike prices with the highest Put OI and highest Call OI.
Is Option Chain Analysis useful for intraday trading?
Yes. Many intraday traders use OI changes, PCR, and support-resistance levels for decision-making.
Can Option Chain Analysis guarantee profits?
No. It improves probability but cannot predict market movements with certainty.