
4 Effective Strategies For Short Term Trading
Short-term trading refers to transactions in which investors buy and sell stocks within a shorter time frame to earn the difference. Short-term traders try to capture the rise and fall of stock prices. Positions are generally held for one to six days, but some periods can be as long as several weeks if the trade is still profitable. Short-term traders use various technical indicators to find trading opportunities to determine the shape, direction and potential short-term changes of trends. In this article, we will discuss 4 Effective Strategies For Short Term Trading.
What is short term trading?
Short-term trading refers to the practice of buying and selling financial assets, such as stocks, currencies or commodities, over a relatively short period of time, usually days, weeks or months. The purpose of short-term trading is to make quick profits by taking advantage of short-term price fluctuations in the market.
Short-term traders often use technical analysis and charting tools to identify short-term price trends and patterns and make decisions based on these trends. They can also use fundamental analysis to evaluate the underlying value of a company or business and gauge its potential for short-term price movements.
Example of Strategies For Short Term Trading :
Strategies For Short Term Trading
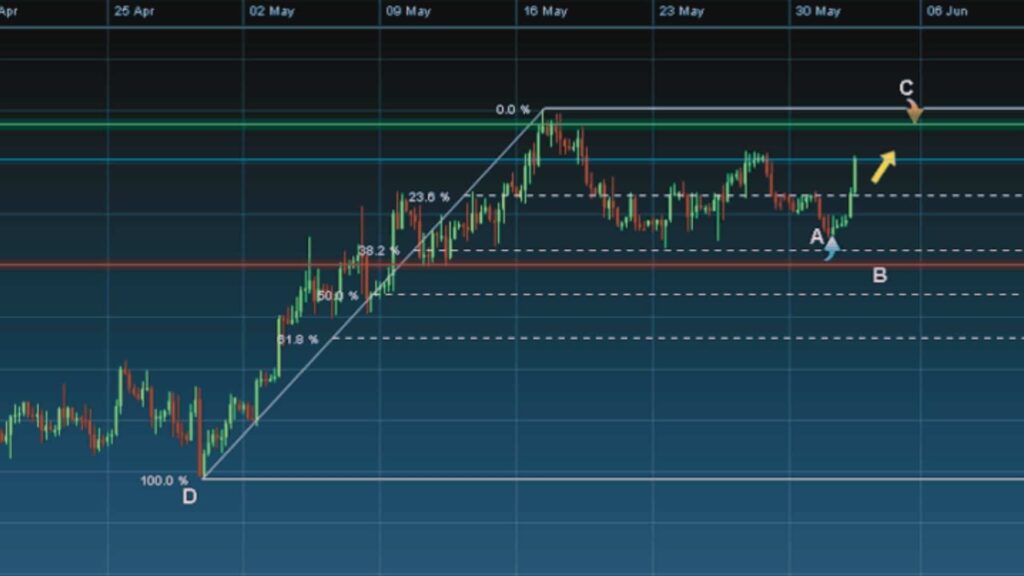
A – Buy point
B – stop loss point
C – Price Prediction (Sell Points)
D – Fibonacci Technical Analysis
Short-term trading can use a variety of strategies. In this example, we show a short-term trading based on trading signals generated by the Fibonacci retracement theory. The three most important points on a stock chart are used in this example: buy point (A), sell point (C) and stop loss point (B). Any short-term trading system should include these three key elements.
Stop loss and sell points do not have to remain at the set price levels, as they will be triggered when certain technical corrections occur in the stock market, which will depend on the short-term trading strategy you are using. The estimated time frame for short-term trading in the stock is about a week. Only by understanding the typical time frames in which short-term trading unfolds can you effectively monitor your trades and maximize your profit potential.
4 Effective Strategies For Short Term Trading
Summarized below are 4 effective strategies For short term trading that you can use to spot trading opportunities and manage your trades from start to finish. Apply these short-term trading techniques to the stocks you are most interested in and find possible buying points.
Support and resistance triggers
Support and resistance levels are the cornerstones of technical analysis, and you can build a successful short-term stock trading strategy around them.
A support level is a price level or area on a chart below the current market price where buying is strong enough to overcome selling pressure. Therefore, the price stops falling and picks up again. Short-term stock traders will consider buying when the support level rebounds, and set a stop loss point below the support level.
Resistance levels are the opposite of support levels. A resistance line indicates a price level or area above the current market price where selling pressure may exceed buying pressure, causing the price to fall into a downtrend. In this case, short-term traders can sell positions after the price rebounds from the resistance level to set a stop loss point above the resistance line.
When incorporating support and resistance levels into your short-term trading system, there is one key thing to remember: when price breaks a support or resistance level, they reverse roles – what was once support becomes resistance and vice versa.
Fibonacci retracement
Fibonacci retracement levels can be used to help traders identify support and resistance levels and thus possible reversal levels on stock charts. Stocks tend to retrace a certain percentage of previous trends and then reverse again, so plotting the horizontal lines of the classic Fibonacci ratios (23.6%, 38.2%, and 61.8%) on a stock chart can reveal potential reversal levels. While not following the rules of the Fibonacci sequence, traders also typically focus on the 50% level, as stocks tend to reverse after halving previous moves.
In a downtrend, if the stock price pulls back to the 61.8% retracement level (acting as resistance) and bounces, short-term traders can start selling positions with the aim of realizing when the price falls to the 23.6% Fibonacci line and rebounds Close a position with a profit.
Simple Moving Average
Another of the most commonly used short-term trading techniques is to use the simple moving average (SMA). SMA smoothes price data by taking the average of prices over a certain period of time (length) in the past and calculating a continuously updated average price.
For example, the 10-day SMA adds the daily closing prices for the past 10 days and divides by 10 to get a new average price for each day. Each average is connected to the next, forming a smooth line on the stock charts. The length used (10 in this case) can be applied to any chart interval, from one minute to weekly. Short-term SMAs react faster to price changes than long-term SMAs.
You can use the 10-day and 20-day SMA short-term trading system and apply the SAS of these two lengths to the stock chart. The short-term SMA (10) is crossing upwards over the long-term SMA (20), showing an uptrend and a buy signal. The short-term SMA crosses the long-term SMA downward, showing a downtrend and a sell signal.
MACD
The moving average convergence divergence (MACD) crossover short-term trading system provides a simple method of identifying short-term trading opportunities. It is one of the most commonly used short-term trading indicators to determine trend direction and reversal. The MACD consists of two moving averages (the MACD line and the signal line), and when these two lines cross, buy and sell signals are generated. If the MACD line crosses the signal line upwards, it shows a bullish trend and is a buy signal. If the MACD line crosses the signal line downwards, there may be a bearish trend, which is a signal to sell. Short-term stock traders will wait for the two lines to cross again, release a reverse trading signal, and then exit the market.
The MACD line fluctuates around the zero line, and trading signals are also generated when the MACD crosses the zero line (buy signal) or falls below the zero line (sell signal).
Summary
All of the above strategies for short term trading can be applied to your stock charts, helping you identify trading opportunities in the markets that interest you most. Short-term trading can be very profitable, but it also carries a high level of risk, as short-term price movements can be volatile and unpredictable. Therefore, short-term traders need to have a good understanding of market dynamics, risk management techniques and trading strategies to be successful in this highly competitive field.
Disclaimer :
Earnmodes is a pure educational platform. This content is provided for general informational purposes only and does not take into account your individual circumstances or objectives. The views expressed in this material do not constitute advice by our website or the author and do not imply that any particular investment, security, transaction or investment strategy is suitable for any particular individual. Earnmodes will not be liable for any direct or indirect losses incurred by you investing based on any information contained herein.